
")
Security and Vulnerability Assessment Market, Global Analysis by Region, End Users, Deployment, Industry & Companies
Get Free Customization in This Report
Security and Vulnerability Assessment market will surpass US$ 14.7 Billion by 2024. Large, small organizations or even individual who are facing the cyber attacks can benefit from the vulnerability assessments. Nowadays, around the globe many organizations whether it’s big or small are spending a lot in the security to identify and remediate flaws before they can exploit.
Global security and vulnerability assessment market is driven by rising global enterprise security spending as well as global average cost of cyber crimes across the globe. Vulnerability assessments let the organization with prior information regarding security short comings in their environment and help them by providing guidelines on how to assess the risk coupled with those faults and sprouting threats. This procedure helps the organizations to analyze of its assets, overall risk and security flaws, reducing the chances that the criminals through cyber attacks will breach its system and catch the business off guard.
Request a free sample copy of the report: https://www.renub.com/contactus.php
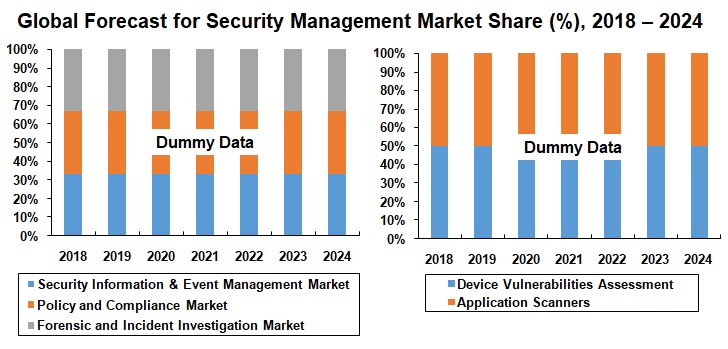
In this report, we have categorized the Security and Vulnerability Assessment market into Security Management Market and Vulnerability Assessment Market. The Security Management market, has been further segmented into
• Security Information and Event Management Market (SIEM)
• Policy and Compliance Market
• Forensic and Incident Investigation Market
Whereas, Vulnerability Assessment Market has been segmented into:
• Device Vulnerabilities Assessment
• Application Scanners
Renub Research report titled “Security and Vulnerability Assessment Market, Global Analysis by Region, End Users, Deployment, Industry, Companies” provides a comprehensive assessment of fast sprouting and high–growth Security and Vulnerability Assessment market. This report studies the Global Security and Vulnerability Assessment market: 1) Market and Forecast 2) Segment Market & Forecast 3) Geographical Market & Forecast 4) Company Wise Security and Vulnerability Assessment market sales & forecast.
Security Information and Event Management Market (SIEM) is leading the Global Security and Vulnerability Assessment Market
Security Information and Event management (SIEM) is dominating the all other segments. Security Information Management (SIM) and Security Event Management (SEM) mixed to form Security Information and Event Management (SIEM). SIM and SEM gather the information, analyze it and in a combined SIEM alert the company officials of some cyber attack so that valuable assets may not hampered by those attacks.
Enterprise dominates the End-User Segment of Security Information & Event Management
Enterprise market is leading the End-User segment of SIEM among all other segments. The factor which is driving this market is complex nature of cyber attacks on large enterprises, Real- time rate reporting, rising compliance & regulatory mandates etc.
By Region - Security Information and Event Management Market
• North America
• Europe
• APAC
• South America
• Rest of the World (ROW)
Client can purchase this report in sections through Purchase by Chapter Tab given above
By End Users - Security Information and Event Management Market
• Enterprise
• Mid-Size
• Small Business
By Deployment - Security Information and Event Management market
• Cloud
• On-Premise
• Hybrid
By Industry - Security Information and Event Management Market
• Financial Services
• IT & Telecommunication
• Government
• Retail
• Healthcare
• Education
• Others
Global Vulnerability Assessment market is segment into
• Device Vulnerabilities Assessment
• Application Scanners
Key Companies covered in the report are as follows
• IBM
• HPE
• Splunk
• Qualys
1. Executive Summary
2. Global Security & Vulnerability Assessment Market
3. Market Share – Global Security & Vulnerability Assessment
3.1 By Application
3.2 Global Vulnerability Assessment
3.2.1 By Segments
3.3 Security Information and Event Management
3.3.1 By Region
3.3.2 By End Users
3.3.3 By Deployment
3.3.4 By Industry
3.4 Company Share Analysis
4. Global Security Management Market
4.1 Security Information and Event Management (SIEM)
4.2 Policy and Compliance Market
4.3 Forensics and Incident Investigation Market
5. Market – Global Security Information and Event Management (SIEM)
5.1 By Regions
5.1.1 North America
5.1.2 Europe
5.1.3 Asia-Pacific (APAC)
5.1.4 South America
5.1.5 Rest of World (ROW)
5.2 By End Users
5.2.1 Enterprise
5.2.2 Mid-Size
5.2.3 Small Business
5.3 By Deployment
5.3.1 Cloud
5.3.2 On-Premise
5.3.3 Hybrid
5.4 By Industry
5.4.1 Financial Services
5.4.2 IT & Telecommunication
5.4.3 Government
5.4.4 Retail
5.4.5 Healthcare
5.4.6 Education
5.4.7 Others
6. Segments – Global Vulnerability Assessment Market
6.1 Device Vulnerbility Assessment Market
6.2 Application Scanners Vulnerbility Assessment Market
7. Industry – Vulnerabilities Profile
7.1 Window of Exposure
7.1.1 Accommodation & Food Services
7.1.2 Arts, Entertainment & Recreation
7.1.3 Educational Services
7.1.4 Finance & Insurance
7.1.5 Healthcare & Social Assistance
7.1.6 Information
7.1.7 Retail Trade
7.1.8 Transportation & Warehousing
7.1.9 Public Administration
7.2 Vulnerabilities by Mobile App Category
7.2.1 Android Vulnerabilities by Mobile App Category
7.2.2 iOS Vulnerabilities By Mobile App Category
8. Company Analysis
8.1 IBM
8.1.1 Company Overview
8.1.2 Company Sales
8.2 HPE
8.2.1 Company Overview
8.2.2 Company Sales
8.3 Splunk
8.3.1 Company Overview
8.3.2 Company Sales
8.4 Qualys
8.4.1 Company Overview
8.4.2 Company Sales
9. Growth Drivers
9.1 Rising Global Enterprise Security Spending
9.2 Global Average Cost of Cyber Crime
10. Challenges
10.1 Lack of Awareness for Security in SMEs
List of Figures:
Figure 2‑1: Global – Security & Vulnerability Assessment Market (Million US$), 2014 – 2017
Figure 2‑2: Global – Forecast for Security & Vulnerability Assessment Market (Million US$), 2018 – 2024
Figure 3‑1: Global – Security Management Market Share (Percent), 2014 – 2017
Figure 3‑2: Global – Forecast for Security Management Market Share (Percent), 2018 – 2024
Figure 3‑3: Global – Vulnerability Assessment Market Share by Segments (Percent), 2014 – 2017
Figure 3‑4: Global – Forecast for Vulnerability Assessment Market Share by Segments (Percent), 2018 – 2024
Figure 3‑5: Global – Security Information & Event Management Market Share by Region (Percent), 2014 – 2017
Figure 3‑6: Global – Forecast for Security Information & Event Management Market Share by Region (Percent), 2018 – 2024
Figure 3‑7: Global – Security Information & Event Management Market Share by End Users (Percent), 2014 – 2017
Figure 3‑8: Global – Forecast for Security Information & Event Management Market Share by End Users (Percent), 2018 – 2024
Figure 3‑9: Global – Security Information & Event Management Market Share by Deployment (Percent), 2014 – 2017
Figure 3‑10: Global – Forecast for Security Information & Event Management Market Share by Deployment (Percent), 2018 – 2024
Figure 3‑11: Global – Security Information & Event Management Market Share by Industry (Percent), 2014 – 2017
Figure 3‑12: Global – Forecast for Security Information & Event Management Market Share by Industry (Percent), 2018 – 2024
Figure 3‑13: Global – Companies Share (Percent), 2014 – 2017
Figure 3‑14: Global – Forecast for Companies Share (Percent), 2018 – 2024
Figure 4‑1: Global - Security Intelligence and Event Management Market (Million US$), 2014 – 2017
Figure 4‑2: Global – Forecast for Security Intelligence and Event Management Market (Million US$), 2018 – 2024
Figure 4‑3: Global – Policy and Compliance Market (Million US$), 2014 – 2017
Figure 4‑4: Global – Forecast for Policy and Compliance Market (Million US$), 2018 – 2024
Figure 4‑5: Global – Forensics and Incident Investigation Market (Million US$), 2014 – 2017
Figure 4‑6: Global – Forecast for Forensics and Incident Investigation Market (Million US$), 2018 – 2024
Figure 5‑1: North America - Security Intelligence and Event Management Market (Million US$), 2014 – 2017
Figure 5‑2: North America – Forecast for Security Intelligence and Event Management Market (Million US$), 2018 – 2024
Figure 5‑3: Europe – Security Intelligence and Event Management Market (Million US$), 2014 – 2017
Figure 5‑4: Europe – Forecast for Security Intelligence and Event Management Market (Million US$), 2018 – 2024
Figure 5‑5: APAC – Security Intelligence and Event Management Market (Million US$), 2014 – 2017
Figure 5‑6: APAC – Forecast for Security Intelligence and Event Management Market (Million US$), 2018 – 2024
Figure 5‑7: South America – Security Intelligence and Event Management Market (Million US$), 2014 – 2017
Figure 5‑8: South America – Forecast for Security Intelligence and Event Management Market (Million US$), 2018 – 2024
Figure 5‑9: ROW – Security Intelligence and Event Management Market (Million US$), 2014 – 2017
Figure 5‑10: ROW – Forecast for Security Intelligence and Event Management Market (Million US$), 2018 – 2024
Figure 5‑11: Global – Security Information and Event Management Market by Enterprise (Million US$), 2014 – 2017
Figure 5‑12: Global – Forecast for Security Information and Event Management Market by Enterprise (Million US$), 2018 – 2024
Figure 5‑13: Global – Security Information and Event Management Market by Mid-Size (Million US$), 2014 – 2017
Figure 5‑14: Global – Forecast for Security Information and Event Management Market by Mid-Size (Million US$), 2018 – 2024
Figure 5‑15: Global – Security Information and Event Management Market by Small Business (Million US$), 2014 – 2017
Figure 5‑16: Global – Forecast for Security Information and Event Management Market by Small Business (Million US$), 2018 – 2024
Figure 5‑17: Global – Security Information and Event Management Market by Cloud (Million US$), 2014 – 2017
Figure 5‑18: Global – Forecast for Security Information and Event Management Market by Cloud (Million US$), 2018 – 2024
Figure 5‑19: Global – Security Information and Event Management Market by On-Premise (Million US$), 2014 – 2017
Figure 5‑20: Global – Forecast for Security Information and Event Management Market by On-Premise (Million US$), 2018 – 2024
Figure 5‑21: Global – Security Information and Event Management Market by Hybrid (Million US$), 2014 – 2017
Figure 5‑22: Global – Forecast for Security Information and Event Management Market by hybrid (Million US$), 2018 – 2024
Figure 5‑23: Global – Security Information and Event Management Market by Financial Services (Million US$), 2014 – 2017
Figure 5‑24: Global – Forecast for Security Information and Event Management Market by Financial Services (Million US$), 2018 – 2024
Figure 5‑25: Global – Security Information and Event Management Market by IT & Telecommunication (Million US$), 2014 – 2017
Figure 5‑26: Global – Forecast for Security Information and Event Management Market by IT & Telecommunication (Million US$), 2018 – 2024
Figure 5‑27: Global – Security Information and Event Management Market by Government (Million US$), 2014 – 2017
Figure 5‑28: Global – Forecast for Security Information and Event Management Market by Government (Million US$), 2018 – 2024
Figure 5‑29: Global – Security Information and Event Management Market by Retail (Million US$), 2014 – 2017
Figure 5‑30: Global – Forecast for Security Information and Event Management Market by Retail (Million US$), 2018 – 2024
Figure 5‑31: Figure 5‑32: Global – Security Information and Event Management Market by Healthcare (Million US$), 2014 – 2017
Figure 5‑33: Global – Forecast for Security Information and Event Management Market by Healthcare (Million US$), 2018 – 2024
Figure 5‑34: Global – Security Information and Event Management Market by Education (Million US$), 2014 – 2017
Figure 5‑35: Global – Forecast for Security Information and Event Management Market by Education (Million US$), 2018 – 2024
Figure 5‑36: Global – Security Information and Event Management Market by Others (Million US$), 2014 – 2017
Figure 5‑37: Global – Forecast for Security Information and Event Management Market by Others (Million US$), 2018 – 2024
Figure 6‑1: Global – Vulnerability Assessment Market by Device (Million US$), 2014 – 2017
Figure 6‑2: Global – Forecast for Vulnerability Assessment Market by Device (Million US$), 2018 – 2024
Figure 6‑3: Global – Vulnerability Assessment Market by Application Scanners (Million US$), 2014 – 2017
Figure 6‑4: Global – Forecast for Vulnerability Assessment Market by Application Scanners (Million US$), 2018 – 2024
Figure 7‑1: Vulnerability Profile by Industry (Percent), 2017
Figure 7‑2: Vulnerability Profile by Industry (Percent), 2017
Figure 7‑3: Accommodation & Food Services - Window of Exposure (Percent), 2017
Figure 7‑4: Arts, Entertainment & Recreation - Window of Exposure (Percent), 2017
Figure 7‑5: Educational Services - Window of Exposure (Percent), 2017
Figure 7‑6: Finance & Insurance - Window of Exposure (Percent), 2017
Figure 7‑7: Healthcare & Social Assistance - Window of Exposure (Percent), 2017
Figure 7‑8: Information - Window of Exposure (Percent), 2017
Figure 7‑9: Retail Trade - Window of Exposure (Percent), 2017
Figure 7‑10: Transportation & Warehousing - Window of Exposure (Percent), 2017
Figure 7‑11: Public Administration - Window of Exposure (Percent), 2017
Figure 7‑12: Android vulnerabilities by mobile app category (Percent), 2017
Figure 7‑13: ios Vulnerabilities by Mobile App Category (Percent), 2017
Figure 8‑1: IBM - Security & Vulnerability Assessment Sales (Million US$), 2014 – 2017
Figure 8‑2: IBM – Forecast for Security & Vulnerability Assessment Sales (Million US$), 2018 – 2024
Figure 8‑3: HPE – Security & Vulnerability Assessment Sales (Million US$), 2014 – 2017
Figure 8‑4: HPE – Forecast for Security & Vulnerability Assessment Sales (Million US$), 2018 – 2024
Figure 8‑5: Splunk – Security & Vulnerability Assessment Sales (Million US$), 2014 – 2017
Figure 8‑6: Splunk – Forecast for Security & Vulnerability Assessment Sales (Million US$), 2018 – 2024
Figure 8‑7: Qualys – Security & Vulnerability Assessment Sales (Million US$), 2014 – 2017
Figure 8‑8: Qualys – Forecast for Security & Vulnerability Assessment Sales (Million US$), 2018 – 2024
Figure 9‑1: Global – Enterprise Security Spending (Billion US$), 2016 – 2024
Figure 9‑2: Global – Average Cost of Cyber Crime (Million US$), 2013 – 2024
Reach out to us
Call us on
USA: +1-678-302-0700
INDIA: +91-120-421-9822
Drop us an email at
info@renub.com