
")
Artificial Sweetener Market Report by Products (Aspartame, Neotame, Sucralose, Acesulfame k, Saccharin, Others), Application (Food and Beverage, Direct Sales, Pharmaceuticals, Others), Region and Company Analysis 2023-2028
Artificial Sweetener Market Outlook
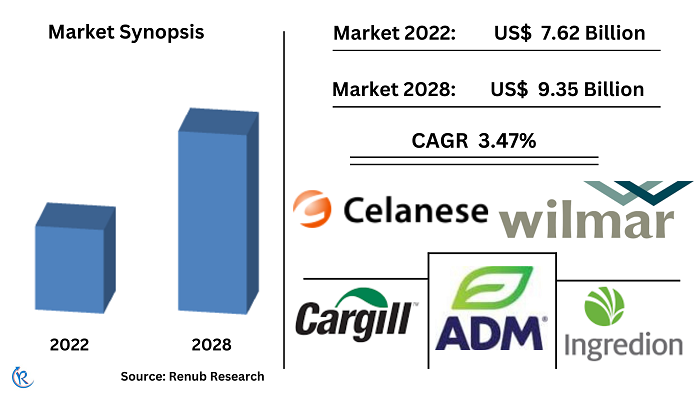
Global Artificial Sweetener Market will reach US$ 9.35 Billion at a CAGR of 3.47% by 2028, according to Renub Research. There is a rising public interest in so-called "zero calories" artificial sweeteners. Artificial sweeteners are used in various food items available in the market, and many manufacturers also use a blend of sugar and artificial sweeteners. Artificial sweeteners were established in a wide range of products in the supermarket can use.
Many tabletop sweeteners add sweetness to tea, coffee, cereal, and fruit instead of several other products, such as cordials, soft drink ice cream, yogurt, ice cream, chewing gum, lollies, desserts, and cakes labeled. These products are often as diet low joule or no sugar. The primary reasons for using artificial sweeteners are weight loss, dental care, diabetes mellitus, reactive hypoglycemia, and low cost.
Some studies have shown the harmful effect of artificial sweeteners on cardiovascular health, with plausible mechanisms. In Sep 2022, World Health Organization warned not to use low-calorie sweeteners to help weight control or reduce the risk of no communicable diseases sparking mixed reactions from industry groups. However, increasing health consciousness among consumers and the increasing number of obese and diabetic patients, growing demand for sugar-free products, prevailing lifestyle diseases, weight loss practices, and rising food processing is expected to keep the market growing effectively. In contrast, high costs and increasing demand for natural sweeteners create a significant challenge for market growth.
Artificial Sweetener Companies Recent Initiatives & Development
Cargill
Cargill has recently launched new food products under the NatureFresh Professional brand. These products include block chocolates, chocolate chips, and cocoa powder, and they are tailored for the Indian Food and Bakery sector. The launch took place at AAHAR in March 2024.
In January 2024, Avansya, a joint venture between Cargill and DSM-Firmenich, announced favorable safety assessments for its EverSweet® stevia sweetener. The European Food Safety Authority (EFSA) and the UK Food Standards Agency (FSA) conducted these assessments. This brings the sweetener closer to commercial launch in the EU and UK.
Tate & Lyle
November 2022 - Tate & Lyle has announced the addition of ERYTESSE™ Erythritol to its sweetener portfolio, expanding its ability to meet the consumer demand for healthier, sugar and calorie-reduced products. The new addition results from a strategic partnership distribution agreement with a leading supplier of erythritol and reinforces Tate & Lyle's position as a world leader in ingredient solutions for more nutritious food and beverages.
In January 2023, Ajinomoto and Tate & Lyle announced a partnership to develop new artificial sweeteners. This partnership will combine Ajinomoto's expertise in amino acids with Tate & Lyle's sweetener expertise.
DuPont de Nemours, Inc
In January 2021, DuPont de Nemours, Inc. invested in R&D to develop Brazzein, a protein sweetener naturally produced in berries. Brazzein is produced by the name Pentadiplandra and is found in Africa.
Aspartame Products will lead Worldwide in the Upcoming Years
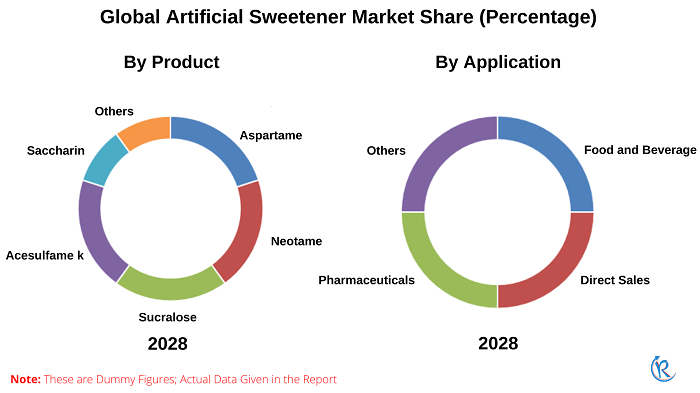
Based on the Product, The Global Artificial Sweetener Market will be divided into six types: Aspartame, Neotame, Sucralose, Acesulfame k, Saccharin, and Others. Aspartame captured the largest share during the forecast period because it is made from amino acids; it provides four kcal/g. Aspartame is 200 times sweeter than sucrose. According to the FDA, the acceptable daily intake of Aspartame for people is 50 mg/kg body weight for adults and children. Aspartame is a sweetener in many products, including chewing gum, primary soda, dry drink mixtures, yogurt and pudding, instant tea, and coffee. Artificial Sweetener has been used in over 6000 varieties of products available in the market.
In the United Kingdom, foods that carry Aspartame are required by the Food Standards Agency to record the substance as an ingredient, with the warning "Contains a source of phenylalanine".
Food & Beverage's Rising Trends will force Market Players to more development in the Artificial Sweetener Market
Food and beverages will dominate the market share due to their application as high-intensity sweeteners in food and beverages. Foods and beverages are a significant area of application of artificial sweeteners, with calorie reduction being the primary goal. Also, it can be used in diabetic foods and beverages, depending on the variety of products, either as single sweetening agents or combined with bulk sugar substitutes suitable for diabetic consumption. Furthermore, Beverage uses of artificial sweeteners account for more than 50% of human consumption. The market is classified into Food and Beverage, Direct Sales, Pharmaceuticals, and others.
Consumers' awareness of the negative health effects of consuming sugar remains the linchpin of the Asian market for artificial sweeteners
Geographically, the market is classified into five types North America, Europe, Asia – Pacific, Latin America, and Middle East & Africa. Asia- Pacific holds the most considerable market revenue due to its rising economies and the increasing popularity of antioxidant-rich food, which reduces the demand for additional ingredients to raise the level of antioxidants.
Furthermore, North America is the fastest-growing artificial sweetener market owing to the rising awareness about healthy food products among consumers and stringent food safety regulations in the region. The U.S. food and drug management have approved the usage of acesulfame-k, neotame, cyclamate, and Aspartame as per acceptable daily intake value. Though the prices of these products are high, consumers are willing to purchase these products.
Key Players
Some key players in the artificial sweetener market include Cargill, Ingredion, Archer Daniels Midland Company, Tate & Lyle, Celanese Corporation, Wilmar International Limited, and DuPont de Nemours, Inc.
- In 2021, Codexis and Tate & Lyle extended a partnership to enhance the production of Tate & Lyle'sLyle's newest Sweetener: Tasteva M Stevia Sweetener.
- In January 2021, AnalytiCon Discovery and Roquette announced their investment in R&D to develop Brazzein, a protein sweetener naturally produced in berries by the name Pentadiplandra which are found in Africa was successful.
Artificial Sweetener Market Segmentation
By Products – Global Artificial Sweetener Market will be divided into six types:-
1. Aspartame
2. Neotame
3. Sucralose
4. Acesulfame k
5. Saccharin
6. Others
By Application – Global Artificial Sweetener Market will be divided into four types:-
1. Food and Beverage
2. Direct Sales
3. Pharmaceuticals
4. Others
By Region – Global Artificial Sweetener Market will be divided into five types:-
1. North America
2. Europe
3. Asia Pacific
4. Latin America
5. Middle East & Africa
Key Players – All the major players have been covered from 3 Viewpoints
1. Overview
2. Recent Developments
3. Revenue
Company Analysis
1. Cargill
2. Ingredion
3. Archer Daniels Midland Company
4. Tate & Lyle
5. Celanese Corporation
6. Wilmar International Limited
7. DuPont de Nemours, Inc.
Report Details:
| Report Features | Details |
| Base Year | 2022 |
| Historical Period | 2018 - 2022 |
| Forecast Period | 2023 - 2028 |
| Market | US$ Billion |
| Segment Covered | Product, Application and Region |
| Region Covered | North America, Europe, Asia Pacific, Latin America, and Middle East & Africa |
| Companies Covered | Cargill, Ingredion, Archer Daniels Midland Company, Tate & Lyle, Celanese Corporation, Wilmar International Limited and DuPont de Nemours, Inc |
| Customization Scope | 20% Free Customization |
| Post-Sale Analyst Support | 1 Year (52 Weeks) |
| Delivery Format | PDF and Excel through Email (We can also provide the editable version of the report in PPT/Word format on request) |
Frequently Asked Questions (FAQ):
1. How big is the Global Artificial Sweetener Market?
2. What will drive the market size of the Global Artificial Sweetener Market?
3. How did the ongoing coronavirus (COVID-19) pandemic impact the growth?
4. Which segment holds the largest market share?
5. How will the Global Artificial Sweetener Market perform in 2028?
1. Introduction
2. Research & Methodology
3. Executive Summary
4. Market Dynamic
4.1 Growth Driver
4.2 Challenges
5. Global Artificial Sweeteners Market
6. Global Artificial Sweeteners Market Share Analysis
6.1 By Product
6.2 By Application
6.3 By Region
7. By Product - Global Artificial Sweeteners Market
7.1 Aspartame
7.2 Neotame
7.3 Sucralose
7.4 Acesulfame k
7.5 Saccharin
7.6 Others
8. By Application - Global Artificial Sweeteners Market
8.1 Food and Beverage
8.2 Direct Sales
8.3 Pharmaceuticals
8.4 Others
9. By Region¬- Global Artificial Sweeteners Market
9.1 North America
9.2 Europe
9.3 Asia pacific
9.4 Latin America
9.5 Middle East & Africa
10. Global Artificial Sweeteners Consumption
11. By Product - Global Artificial Sweeteners Consumption
11.1 Aspartame
11.2 Neotame
11.3 Sucralose
11.4 Acesulfame k
11.5 Saccharin
11.6 Others
12. By Application - Global Artificial Sweeteners Consumption
12.1 Food and Beverage
12.2 Direct Sales
12.3 Pharmaceuticals
12.4 Others
13. By Region - Global Artificial Sweeteners Consumption
13.1 North America
13.2 Europe
13.3 Asia pacific
13.4 Latin America
13.5 Middle East & Africa
14. Acceptable Daily Intake (ADI) Levels for Artificial Sweeteners
15. Company – Financial Insights
15.1 Cargill
15.1.1 Overview
15.1.2 Recent Development
15.1.3 Financial Insight
15.2 Ingredion
15.2.1 Overview
15.2.2 Recent Development
15.2.3 Financial Insight
15.3 Archer Daniels Midland Company
15.3.1 Overview
15.3.2 Recent Development
15.3.3 Financial Insight
15.4 Tate & Lyle
15.4.1 Overview
15.4.2 Recent Development
15.4.3 Financial Insight
15.5 Celanese Corporation
15.5.1 Overview
15.5.2 Recent Development
15.5.3 Financial Insight
15.6 Wilmar International Limited
15.6.1 Overview
15.6.2 Recent Development
15.6.3 Financial Insight
15.7 DuPont de Nemours, Inc.
15.7.1 Overview
15.7.2 Recent Development
15.7.3 Financial Insight
List of Figures:
Figure-01: Global – Artificial Sweeteners Market (Billion US$), 2018 – 2022
Figure-02: Global – Forecast for Artificial Sweeteners Market (Billion US$), 2023 – 2028
Figure-03: Product – Aspartame Market (Million US$), 2018 – 2022
Figure-04: Product – Forecast for Aspartame Market (Million US$), 2023 – 2028
Figure-05: Product – Neotame Market (Million US$), 2018 – 2022
Figure-06: Product – Forecast for Neotame Market (Million US$), 2023 – 2028
Figure-07: Product – Sucralose Market (Million US$), 2018 – 2022
Figure-08: Product – Forecast for Sucralose Market (Million US$), 2023 – 2028
Figure-09: Product – Acesulfame k Market (Million US$), 2018 – 2022
Figure-10: Product – Forecast for Acesulfame k Market (Million US$), 2023 – 2028
Figure-11: Product – Saccharin Market (Million US$), 2018 – 2022
Figure-12: Product – Forecast for Saccharin Market (Million US$), 2023 – 2028
Figure-13: Product – Others Market (Million US$), 2018 – 2022
Figure-14: Product – Forecast for Others Market (Million US$), 2023 – 2028
Figure-15: Application – Food and Beverage Market (Million US$), 2018 – 2022
Figure-16: Application – Forecast for Food and Beverage Market (Million US$), 2023 – 2028
Figure-17: Application – Direct Sales Market (Million US$), 2018 – 2022
Figure-18: Application – Forecast for Direct Sales Market (Million US$), 2023 – 2028
Figure-19: Application – Pharmaceuticals Market (Million US$), 2018 – 2022
Figure-20: Application – Forecast for Pharmaceuticals Market (Million US$), 2023 – 2028
Figure-21: Application – Others Market (Million US$), 2018 – 2022
Figure-22: Application – Forecast for Others Market (Million US$), 2023 – 2028
Figure-23: North America – Artificial Sweeteners Market (Million US$), 2018 – 2022
Figure-24: North America – Forecast for Artificial Sweeteners Market (Million US$), 2023 – 2028
Figure-25: Europe – Artificial Sweeteners Market (Million US$), 2018 – 2022
Figure-26: Europe – Forecast for Artificial Sweeteners Market (Million US$), 2023 – 2028
Figure-27: Asia pacific – Artificial Sweeteners Market (Million US$), 2018 – 2022
Figure-28: Asia pacific – Forecast for Artificial Sweeteners Market (Million US$), 2023 – 2028
Figure-29: Latin America – Artificial Sweeteners Market (Million US$), 2018 – 2022
Figure-30: Latin America – Forecast for Artificial Sweeteners Market (Million US$), 2023 – 2028
Figure-31: Middle East & Africa – Artificial Sweeteners Market (Million US$), 2018 – 2022
Figure-32: Middle East & Africa – Forecast for Artificial Sweeteners Market (Million US$), 2023 – 2028
Figure-33: Product – Aspartame Consumption Volume (Thousand Tons), 2018 – 2022
Figure-34: Product – Forecast for Aspartame Consumption Volume (Thousand Tons), 2023 – 2028
Figure-35: Product – Neotame Consumption Volume (Thousand Tons), 2018 – 2022
Figure-36: Product – Forecast for Neotame Consumption Volume (Thousand Tons), 2023 – 2028
Figure-37: Product – Sucralose Consumption Volume (Thousand Tons), 2018 – 2022
Figure-38: Product – Forecast for Sucralose Consumption Volume (Thousand Tons), 2023 – 2028
Figure-39: Product – Acesulfame k Consumption Volume (Thousand Tons), 2018 – 2022
Figure-40: Product – Forecast for Acesulfame k Consumption Volume (Thousand Tons), 2023 – 2028
Figure-41: Product – Saccharin Consumption Volume (Thousand Tons), 2018 – 2022
Figure-42: Product – Forecast for Saccharin Consumption Volume (Thousand Tons), 2023 – 2028
Figure-43: Product – Others Consumption Volume (Thousand Tons), 2018 – 2022
Figure-44: Product – Forecast for Others Consumption Volume (Thousand Tons), 2023 – 2028
Figure-45: Application – Food and Beverage Consumption Volume (Thousand Tons), 2018 – 2022
Figure-46: Application – Forecast for Food and Beverage Consumption Volume (Thousand Tons), 2023 – 2028
Figure-47: Application – Direct Sales Consumption Volume (Thousand Tons), 2018 – 2022
Figure-48: Application – Forecast for Direct Sales Consumption Volume (Thousand Tons), 2023 – 2028
Figure-49: Application – Pharmaceuticals Consumption Volume (Thousand Tons), 2018 – 2022
Figure-50: Application – Forecast for Pharmaceuticals Consumption Volume (Thousand Tons), 2023 – 2028
Figure-51: Application – Others Consumption Volume (Thousand Tons), 2018 – 2022
Figure-52: Application – Forecast for Others Consumption Volume (Thousand Tons), 2023 – 2028
Figure-53: North America – Artificial Sweeteners Consumption Volume (Thousand Tons), 2018 – 2022
Figure-54: North America – Forecast for Artificial Sweeteners Consumption Volume (Thousand Tons), 2023 – 2028
Figure-55: Europe – Artificial Sweeteners Consumption Volume (Thousand Tons), 2018 – 2022
Figure-56: Europe – Forecast for Artificial Sweeteners Consumption Volume (Thousand Tons), 2023 – 2028
Figure-57: Asia pacific – Artificial Sweeteners Consumption Volume (Thousand Tons), 2018 – 2022
Figure-58: Asia pacific – Forecast for Artificial Sweeteners Consumption Volume (Thousand Tons), 2023 – 2028
Figure-59: Latin America – Artificial Sweeteners Consumption Volume (Thousand Tons), 2018 – 2022
Figure-60: Latin America – Forecast for Artificial Sweeteners Consumption Volume (Thousand Tons), 2023 – 2028
Figure-61: Middle East & Africa – Artificial Sweeteners Consumption Volume (Thousand Tons), 2018 – 2022
Figure-62: Middle East & Africa – Forecast for Artificial Sweeteners Consumption Volume (Thousand Tons), 2023 – 2028
Figure-63: Cargill – Global Revenue (Billion US$), 2018 – 2022
Figure-64: Cargill – Forecast for Global Revenue (Billion US$), 2023 – 2028
Figure-65: Ingredion – Global Revenue (Billion US$), 2018 – 2022
Figure-66: Ingredion – Forecast for Global Revenue (Billion US$), 2023 – 2028
Figure-67: Archer Daniels Midland Company – Global Revenue (Billion US$), 2018 – 2022
Figure-68: Archer Daniels Midland Company – Forecast for Global Revenue (Billion US$), 2023 – 2028
Figure-69: Tate & Lyle – Global Revenue (Billion US$), 2018 – 2022
Figure-70: Tate & Lyle – Forecast for Global Revenue (Billion US$), 2023 – 2028
Figure-71: Celanese Corporation – Global Revenue (Billion US$), 2018 – 2022
Figure-72: Celanese Corporation – Forecast for Global Revenue (Billion US$), 2023 – 2028
Figure-73: Wilmar International Limited – Global Revenue (Billion US$), 2018 – 2022
Figure-74: Wilmar International Limited – Forecast for Global Revenue (Billion US$), 2023 – 2028
Figure-75: DuPont de Nemours, Inc. – Global Revenue (Billion US$), 2018 – 2022
Figure-76: DuPont de Nemours, Inc. – Forecast for Global Revenue (Billion US$), 2023 – 2028
List of Tables:
Table-01: Global – Artificial Sweeteners Market Share by Product (Percent), 2018 – 2022
Table-02: Global – Forecast for Artificial Sweeteners Market Share by Product (Percent), 2023 – 2028
Table-03: Global – Artificial Sweeteners Market Share by Application (Percent), 2018 – 2022
Table-04: Global – Forecast for Artificial Sweeteners Market Share by Application (Percent), 2023 – 2028
Table-05: Global – Artificial Sweeteners Market Share by Region (Percent), 2018 – 2022
Table-06: Global – Forecast for Artificial Sweeteners Market Share by Regions(Percent), 2023 – 2028
Reach out to us
Call us on
USA: +1-678-302-0700
INDIA: +91-120-421-9822
Drop us an email at
info@renub.com