
")
Energy Storage System Market, Volume, Global Forecast by End-User, Region & Companies
Get Free Customization in This Report
Energy Storage System market is expected to be more than US$ 21 Billion globally by the end of year 2024. This report covers key growth drivers and scientific challenges for Energy Storage System market. The set of methods and technologies used to store various kind of energy like Mechanical (Pumped hydro, Compressed air energy and Flywheels), Electrochemical, Thermal and Chemical known as Energy Storage System. Globally fluctuation in electricity and demand for electricity in many sectors like industries, transportation, and residential use developed technology to store electrical energy so it can be used whenever needed. Energy storage allows a lower-cost generating source to generate electricity at a diverse point in time to be stored and then used to meet times of crest demand.
Request a free sample copy of the report: https://www.renub.com/contactus.php
Renub Research latest report “Energy Storage System Market, Volume, Global Forecast by End-User (Utility-Scale, Commercial & Industrial, Residential, Remote Power System) Region (East Asia & Pacific, South Asia, Eastern Europe & Central Asia, Latin America & the Caribbean, Sub-Saharan Africa, Middle East and North Africa) Companies (Samsung SDI., LG Chemical, SANYO-Panasonic, BYD Company Limited, ATL and Exide Technologies)” provides a detailed and comprehensive insight of the Global Energy Storage System Market. This report studies the Global Energy Storage System Market and Volume from 4 view points by End-User and further 6 view points by Region.
By End-User - Energy Storage System Market & Volume
1. Utility-Scale
2. Commercial & Industrial
3. Residential
4. Remote Power System
By Region - Energy Storage System Market & Volume
1. East Asia & Pacific
2. South Asia
3. Eastern Europe & Central Asia
4. Latin America & the Caribbean
5. Sub-Saharan Africa
6. Middle East and North Africa
Utility-Scale, Commercial & Industrial, Residential and Remote Power System - By Region
1. East Asia & Pacific
2. South Asia
3. Eastern Europe & Central Asia
4. Latin America & the Caribbean
5. Sub-Saharan Africa
6. Middle East and North Africa
Key Player covered in the Report
1. Samsung SDI.
2. LG Chemical
3. SANYO-Panasonic
4. BYD Company Limited
5. ATL
6. Exide Technologies
Client can purchase this report in sections through Purchase by Chapter Tab given above
Scope of the Report
- Market by End-User: We have segmented the market into four applications which are Utility-Scale, Commercial & Industrial, Residential and Remote Power System.
- Volume by End-User: We have segmented the volume sales into four applications which are Utility-Scale, Commercial & Industrial, Residential and Remote Power System. We have taken volume in Mega Watt for each of mentioned segment.
- Market by Region: We have segmented the market into six parts by region which are East Asia & Pacific, South Asia, Eastern Europe & Central Asia, Latin America & the Caribbean, Sub-Saharan Africa and Middle East and North Africa. Moreover we have also fragmented most important key drivers for the region.
- Volume by Region: We have segmented the volume sales into six parts by region which are East Asia & Pacific, South Asia, Eastern Europe & Central Asia, Latin America & the Caribbean, Sub-Saharan Africa and Middle East and North Africa.
- Market Share Analysis: We have mentioned market share from two view points: energy storage system volume share by application and by region.
- Volume Share Analysis: We have also mentioned volume share from two view points: energy storage system volume share by application and by region.
- Key Growth Drivers & Challenges: Report studies the multi-dimensional factors which help to grow global energy storage system market. We have also studied key factors that will hinder the market growth.
- Key Players Analysis: We have covered six key players and their overview of the company and their business strategies.
1. Executive Summery
2. Global ESS (Energy Storage System) Market
3. Global ESS (Energy Storage System) Volume
4. Market Share – Global Energy Storage System (2016 – 2024)
4.1 By End-User
4.2 By Region
5. Volume Share – Energy Storage System (ESS) Analysis (2016 – 2024)
5.1 By End-User
5.2 By Region
6. By End-User – Market & Volume (2016 – 2024)
6.1 Utility-Scale
6.1.1 Market
6.1.2 Volume
6.2 Commercial & Industrial
6.2.1 Market
6.2.2 Volume
6.3 Residential
6.3.1 Market
6.3.2 Volume
6.4 Remote Power System
6.4.1 Market
6.4.2 Volume
7. By Region – Market & Volume (2016 – 2024)
7.1 East Asia & Pacific
7.1.1 Market
7.1.2 Volume
7.2 South Asia
7.2.1 Market
7.2.2 Volume
7.3 Eastern Europe & Central Asia
7.3.1 Market
7.3.2 Volume
7.4 Latin America & the Caribbean
7.4.1 Market
7.4.2 Volume
7.5 Sub-Saharan Africa
7.5.1 Market
7.5.2 Volume
7.6 Middle East & North Africa
7.6.1 Market
7.6.2 Volume
8. Utility-Scale ESS Market – by Region
8.1 East Asia & Pacific
8.2 South Asia
8.3 Eastern Europe & Central Asia
8.4 Latin America & the Caribbean
8.5 Sub-Saharan Africa
8.6 Middle East & North Africa
9. Commercial & Industrial ESS Market – by Regions
9.1 East Asia & Pacific
9.2 South Asia
9.3 Eastern Europe & Central Asia
9.4 Latin America & the Caribbean
9.5 Sub-Saharan Africa
9.6 Middle East & North Africa
10. Residential ESS Market – by Regions
10.1 East Asia & Pacific
10.2 Rest of World
11. Remote Power System ESS Market by Regions
11.1 East Asia & Pacific
11.2 South Asia
11.3 Eastern Europe & Central Asia
11.4 Latin America & the Caribbean
11.5 Sub-Saharan Africa
11.6 Middle East & North Africa
12. Key Growth Drivers (Due to data confidentiality, growth drivers have not been disclosed in this table of contents)
12.1 Point No. 1
12.2 Point no. 2
12.3 Point No. 3
12.4 Point No. 4
13. Key Challenges (Due to data confidentiality, challenges have not been disclosed in this table of contents)
13.1 Point No. 1
14. Global Key Players Analysis
14.1 LG Chem. Power (LGCPI) – Company Analysis
14.1.1 Overview
14.1.2 Business Strategy
14.2 Samsung SDI – Company Analysis
14.2.1 Overview
14.2.2 Business Strategy
14.3 SANYO-PANASONIC – Company Analysis
14.3.1 Overview
14.3.2 Business Strategy
14.4 Amperex Technology Limited (ATL) – Company Analysis
14.4.1 Overview
14.4.2 Business Strategy
14.5 Exide Technology
14.5.1 Overview
14.5.2 Business strategy
14.6 BYD Corporation Ltd
14.6.1 Overview
14.6.2 Business strategy
Figure 2‑1: Global - Energy Storage System Market (Million US$), 2016 – 2017
Figure 2‑2: Forecast for Global - Energy Storage System Market (Million US$), 2018 – 2024
Figure 3‑1: Global - Energy Storage System Volume (Mega Watt), 2016 – 2017
Figure 3‑2: Forecast for Global - Energy Storage System Volume (Mega Watt), 2018 – 2024
Figure 4‑1: By Application - Global Energy Storage System Market Share (%), 2016 – 2017
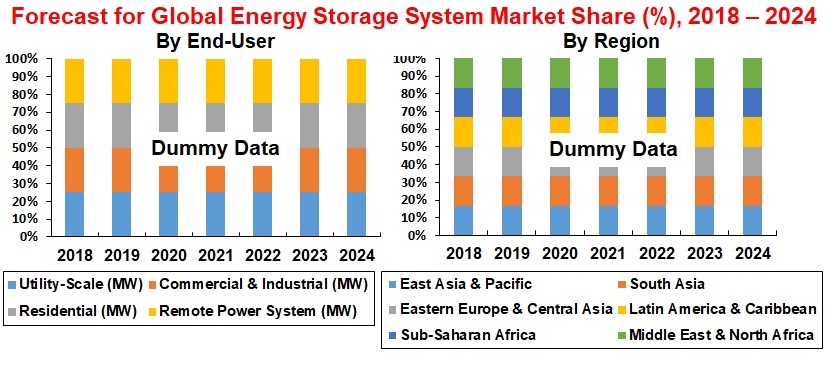
Figure 4‑2: By Application - Forecast for Global Energy Storage System Market Share (%), 2018 – 2024
Figure 4‑3: By Region - Global Energy Storage System Market Share (%), 2016 – 2017
Figure 4‑4: By Region – Forecast for Global Energy Storage System Market Share (%), 2018 – 2024
Figure 5‑1: By Application - Global Energy Storage System Volume Share (%), 2016 – 2017
Figure 5‑2: By Application – Forecast for Global Energy Storage System Volume Share (%), 2018 – 2024
Figure 5‑3: By Region - Global Energy Storage System Volume Share (%), 2016 – 2017
Figure 5‑4: By Region – Forecast for Global Energy Storage System Volume Share (%), 2018 – 2024
Figure 6‑1: Global - Utility Scale Energy Storage System Market (Million US$), 2016 – 2017
Figure 6‑2: Forecast for Global - Utility Scale Energy Storage System Market (Million US$), 2018 – 2024
Figure 6‑3: Global – Utility Scale Energy Storage System Volume (Mega Watt), 2016 – 2017
Figure 6‑4: Forecast for Global – Utility Scale Energy Storage System Volume (Mega Watt), 2018 – 2024
Figure 6‑5: Global – Commercial & Industrial Energy Storage System Market (Million US$), 2016 – 2017
Figure 6‑6: Forecast for Global – Commercial & Industrial Energy Storage System Market (Million US$), 2018 – 2024
Figure 6‑7: Global – Commercial & Industrial Energy Storage System Volume (Mega Watt), 2016 – 2017
Figure 6‑8: Forecast for Global – Commercial & Industrial Energy Storage System Volume (Mega Watt), 2018 – 2024
Figure 6‑9: Global – Residential Energy Storage System Market (Million US$), 2017
Figure 6‑10: Forecast for Global – Residential Energy Storage System Market (Million US$), 2018 – 2024
Figure 6‑11: Global – Residential Energy Storage System Volume (Mega Watt), 2017
Figure 6‑12: Forecast for Global – Residential Energy Storage System Volume (Mega Watt), 2018 – 2024
Figure 6‑13: Global – Remote Power Energy Storage System Market (Million US$), 2016 – 2017
Figure 6‑14: Forecast for Global – Remote Power Energy Storage System Market (Million US$), 2018 – 2024
Figure 6‑15: Global – Remote Power Energy Storage System Volume (Mega Watt), 2016 – 2017
Figure 6‑16: Forecast for Global – Remote Power Energy Storage System Volume (Mega Watt), 2018 – 2024
Figure 7‑1: East Asia & Pacific Energy Storage System Market (Million US$), 2016 – 2017
Figure 7‑2: Forecast for East Asia & Pacific Energy Storage System Market (Million US$), 2018 – 2024
Figure 7‑3: East Asia & Pacific Energy Storage System Volume (Mega Watt), 2016 – 2017
Figure 7‑4: Forecast for East Asia & Pacific Energy Storage System Volume (Mega Watt), 2018 – 2024
Figure 7‑5: South Asia Energy Storage System Market (Million US$), 2016 – 2017
Figure 7‑6: Forecast for South Asia Energy Storage System Market (Million US$), 2018 – 2024
Figure 7‑7: South Asia Energy Storage System Volume (Mega Watt), 2016 – 2017
Figure 7‑8: Forecast for South Asia Energy Storage System Volume (Mega Watt), 2018 – 2024
Figure 7‑9: Eastern Europe & Central Asia Energy Storage System Market (Million US$), 2016 – 2017
Figure 7‑10: Forecast for Eastern Europe & Central Asia Energy Storage System Market (Million US$), 2018 – 2024
Figure 7‑11: Eastern Europe & Central Asia Energy Storage System Volume (Mega Watt), 2016 – 2017
Figure 7‑12: Forecast for Eastern Europe & Central Asia Energy Storage System Volume (Mega Watt), 2018 – 2024
Figure 7‑13: Latin America & the Caribbean Energy Storage System Market (Million US$), 2016 – 2017
Figure 7‑14: Forecast for Latin America & the Caribbean Energy Storage System Market (Million US$), 2018 – 2024
Figure 7‑15: Latin America & the Caribbean Energy Storage System Volume (Mega Watt), 2016 – 2017
Figure 7‑16: Forecast for Latin America & the Caribbean Energy Storage System Volume (Mega Watt), 2018 – 2024
Figure 7‑17: Sub-Saharan Africa Energy Storage System Market (Million US$), 2016 – 2017
Figure 7‑18: Forecast for Sub-Saharan Africa Energy Storage System Market (Million US$), 2018 – 2024
Figure 7‑19: Sub-Saharan Africa Energy Storage System Volume (Mega Watt), 2016 – 2017
Figure 7‑20: Forecast for Sub-Saharan Africa Energy Storage System Volume (Mega Watt), 2018 – 2024
Figure 7‑21: Middle East & North Africa Energy Storage System Market (Million US$), 2016 – 2017
Figure 7‑22: Forecast for Middle East & North Africa Energy Storage System Market (Million US$), 2018 – 2024
Figure 7‑23: Middle East & North Africa Energy Storage System Volume (Mega Watt), 2016 – 2017
Figure 7‑24: Forecast for Middle East & North Africa Energy Storage System Volume (Mega Watt), 2018 – 2024
Figure 8‑1: East Asia & Pacific - Utility-Scale Energy Storage System Market (Million US$), 2016 – 2017
Figure 8‑2: Forecast for East Asia & Pacific - Utility-Scale Energy Storage System Market (Million US$), 2018 – 2024
Figure 8‑3: South Asia - Utility-Scale Energy Storage System Market (Million US$), 2016 – 2017
Figure 8‑4: Forecast for South Asia - Utility-Scale Energy Storage System Market (Million US$), 2018 – 2024
Figure 8‑5: Eastern Europe & Central Asia - Utility-Scale Energy Storage System Market (Million US$), 2016 – 2017
Figure 8‑6: Forecast for Eastern Europe & Central Asia - Utility-Scale Energy Storage System Market (Million US$), 2018 – 2024
Figure 8‑7: Latin America & the Caribbean - Utility-Scale Energy Storage System Market (Million US$), 2016 – 2017
Figure 8‑8: Forecast for Latin America & the Caribbean - Utility-Scale Energy Storage System Market (Million US$), 2018 – 2024
Figure 8‑9: Sub-Saharan Africa - Utility-Scale Energy Storage System Market (Million US$), 2016 – 2017
Figure 8‑10: Forecast for Sub-Saharan Africa - Utility-Scale Energy Storage System Market (Million US$), 2018 – 2024
Figure 8‑11: Middle East & North Africa - Utility-Scale Energy Storage System Market (Million US$), 2016 – 2017
Figure 8‑12: Forecast for Middle East & North Africa - Utility-Scale Energy Storage System Market (Million US$), 2018 – 2024
Figure 9‑1: East Asia & Pacific - Commercial & Industrial Energy Storage System Market (Million US$), 2016 – 2017
Figure 9‑2: Forecast for East Asia & Pacific - Commercial & Industrial Energy Storage System Market (Million US$), 2018 – 2024
Figure 9‑3: South Asia - Commercial & Industrial Energy Storage System Market (Million US$), 2016 – 2017
Figure 9‑4: Forecast for South Asia - Commercial & Industrial Energy Storage System Market (Million US$), 2018 – 2024
Figure 9‑5: Eastern Europe & Central Asia - Commercial & Industrial Energy Storage System Market (Million US$), 2016 – 2017
Figure 9‑6: Forecast for Eastern Europe & Central Asia - Commercial & Industrial Energy Storage System Market (Million US$), 2018 – 2024
Figure 9‑7: Latin America & the Caribbean - Commercial & Industrial Energy Storage System Market (Million US$), 2016 – 2017
Figure 9‑8: Forecast for Latin America & the Caribbean - Commercial & Industrial Energy Storage System Market (Million US$), 2018 – 2024
Figure 9‑9: Sub-Saharan Africa - Commercial & Industrial Energy Storage System Market (Million US$), 2016 – 2017
Figure 9‑10: Forecast for Sub-Saharan Africa - Commercial & Industrial Energy Storage System Market (Million US$), 2018 – 2024
Figure 9‑11: Middle East & North Africa - Commercial & Industrial Energy Storage System Market (Million US$), 2016 – 2017
Figure 9‑12: Forecast for Middle East & North Africa - Commercial & Industrial Energy Storage System Market (Million US$), 2018 – 2024
Figure 10‑1: East Asia & Pacific - Residential ESS Market & Forecast (Million US$), 2017 - 2024
Figure 10‑2: Rest of World - Residential ESS Market & Forecast (Million US$), 2017 - 2024
Figure 11‑1: East Asia & Pacific - Remote Power Energy Storage System Market (Million US$), 2016 – 2017
Figure 11‑2: Forecast for East Asia & Pacific - Remote Power Energy Storage System Market (Million US$), 2018 – 2024
Figure 11‑3: South Asia - Remote Power Energy Storage System Market (Million US$), 2016 – 2017
Figure 11‑4: Forecast for South Asia - Remote Power Energy Storage System Market (Million US$), 2018 – 2024
Figure 11‑5: Eastern Europe & Central Asia - Remote Power Energy Storage System Market (Million US$), 2016 – 2017
Figure 11‑6: Forecast for Eastern Europe & Central Asia - Remote Power Energy Storage System Market (Million US$), 2018 – 2024
Figure 11‑7: Latin America & the Caribbean - Remote Power Energy Storage System Market (Million US$), 2016 – 2017
Figure 11‑8: Forecast for Latin America & the Caribbean - Remote Power Energy Storage System Market (Million US$), 2018 – 2024
Figure 11‑9: Sub-Saharan Africa - Remote Power Energy Storage System Market (Million US$), 2016 – 2017
Figure 11‑10: Forecast for Sub-Saharan Africa - Remote Power Energy Storage System Market (Million US$), 2018 – 2024
Figure 11‑11: Middle East & North Africa - Remote Power Energy Storage System Market (Million US$), 2016 – 2017
Figure 11‑12: Forecast for Middle East & North Africa - Remote Power Energy Storage System Market (Million US$), 2018 – 2024
Figure 12‑1: Global - Lithium-ion Battery Price Survey (US$/KWH), 2010 – 2016
Reach out to us
Call us on
USA: +1-678-302-0700
INDIA: +91-120-421-9822
Drop us an email at
info@renub.com